Home > News
Horizontal structure of the fastest Rossby mode on the sphere, n=1 Rossby wave.
Geopotential height is scaled by the maximal height. Colours vary between -1 and +1 with positive/negative perturbations in red/blue.
Horizontal structure of the n=0 eastward-propagating inertia-gravity mode on the sphere, Kelvin wave.
Geopotential height is scaled by the maximal height. Colours vary between -1 and +1 with positive/negative perturbations in red/blue.
Horizontal structure of the n=0 westward-propagating rotational mode on the sphere, mixed Rossby-gravity wave.
Geopotential height is scaled by the maximal height. Colours vary between -1 and +1 with positive/negative perturbations in red/blue.
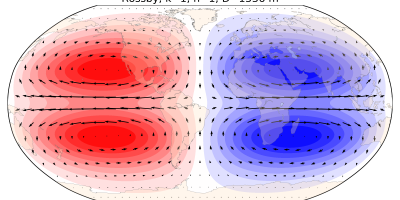
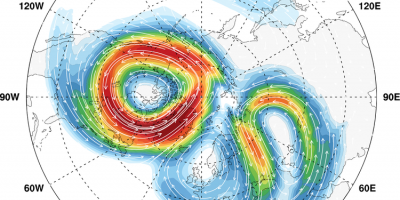
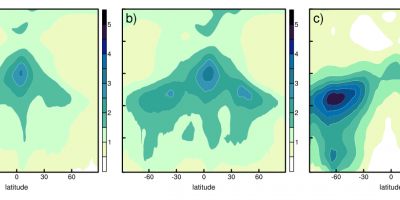
Horizontal structure of the slowest westward-propagating inertia-gravity (WIG) mode on the sphere, n=0 WIG wave.
Geopotential height is scaled by the maximal height. Colours vary between -1 and +1 with positive/negative perturbations in red/blue.

In his first paper on Kelvin waves (KWs), Marten Blaauw used MODES to study Kelvin wave seasonal variability in the operational L91 ECMWF analyses in the 2007–2013 period.   His results

Stratospheric polar vortex Feb 2018

MODES movies of balanced winds in February 2018 are available at https://www.fmf.uni-lj.si/~zagarn/downloads/PolarVortex_022018/ for levels 1 hPa, 5 hPa, 10 hPa, 20 hPa, 30 hPa, 50 hPa, 100 hPa, 150 hPa and 200 hPa.

Growth of the 3D global circulation forecast errors in synoptic scales

A Python tool for fitting the logistic curve to the forecast error growth data is available here.
It is using the standard package scipy.optimize. An example is included.

Our paper in Journal of Atmospehric sciences described the application of MODES to quantify temperature and wind perturbations associated with the IG waves in global analysis da

NWP, forecast errors, MODES

A global perspective of the limits of prediction skill of NWP models has been published in Tellus A. 

Pages