In his first paper on Kelvin waves (KWs), Marten Blaauw used MODES to study Kelvin wave seasonal variability in the operational L91 ECMWF analyses in the 2007–2013 period. His results provide the global KW energy spectrum which shows a clear seasonal cycle with the KW activity predominantly in zonal wavenumbers 1–2, where up to 50 % more energy is observed during the solstice seasons in comparison with boreal spring and autumn. He used a spectral bandpass filtering to decompose KW seasonal variability in the upper troposphere and lower stratosphere into three period ranges: seasonal, intra-seasonal and intra-monthly variability components. Results reveal a slow seasonal KW component with a robust dipole structure in the upper troposphere with its position determined by the location of the dominant convective outflow throughout the seasons. Its maximal strength occurs during boreal summer when easterlies in the eastern hemisphere are strongest. The two other components represent vertically propagating KWs and are observed throughout the year with seasonal variability mostly found in the wave amplitudes being dependent on the seasonality of the background easterly winds and static stability.
The full article: Atmos. Chem. Phys., 18, 8313-8330, 2018. https://doi.org/10.5194/acp-18-8313-2018
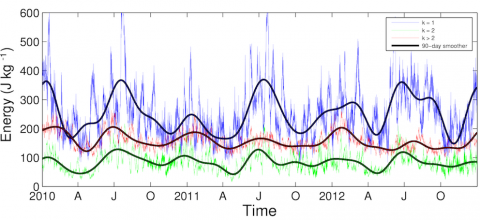
Figure: Time series of the global total KW energy for various zonal wavenumbers in 2010–2012. Labels on the x axis “A”, “J” and “O” refer to the first days of April, July and October, respectively. Presented are the zonal wavenumbers k=1 (blue line), k=2 (green line) and all smaller zonal scales, k > 2 (red line). A 90 day low-pass filter is applied (black lines) for each time series in order to filter out high-frequency variability and to highlight seasonal variability. This is Figure 5b from the paper.